Understanding of the terms spectral resolution and spectral point spacing may sometimes lead to confusion. This is due to the fact that very often, especially when talking about FTIR spectrometers, these two parameters are used interchangeably. And such use is misleading. We provide here the explanations of these quantities.
Spectral resolution
Spectral resolution is the wavenumber, wavelength or frequency difference of two still distinguishable lines in a spectrum (after IUPAC, Green Book, 2nd ed., p. 31). Spectral resolution defines what would be the narrowest spectral feature that can be resolved, or the necessary spacing between two features that enables to distinguish them. On the other hand, the observed/registered signal is a convolution of spectral resolution of the spectrometer and the linewidth of the signal. If the spectral feature is substantially wider than the spectral resolution, the effect of the resolution is negligible.
FTIR spectrometers are equipped with broadband light sources (e.g. glowbars), and their spectral resolution is defined by the optical path difference in the interferometer. In the IRis-F1, the source is a QCL frequency comb. When talking about laser sources, we attribute the resolution to the laser linewidth (or, more precisely to the full width at half maximum). In the IRis-F1, there is a laser source, but instead of one line, there are several – and the linewidth of each line, i.e. the spectral resolution,is <3×10⁻⁴ cm-1. A connected parameter is the resolving power and for example at 1200 cm-1 (belonging to the fingerprint region), it is: ṽ /Δṽ = 1200 cm-1 / 3×10⁻⁴ cm-1 = 4’000’000:1.
Point spacing
Point spacing– separation between two adjacent data points in the spectrum. It corresponds to points that can be probed. Commonly, spectral point spacing is smaller than spectral resolution. However, for the IRis-F1, the situation is reverse: the spectral resolution is <3×10⁻⁴ cm-1, while the point spacing is ca. 0.3 cm-1.
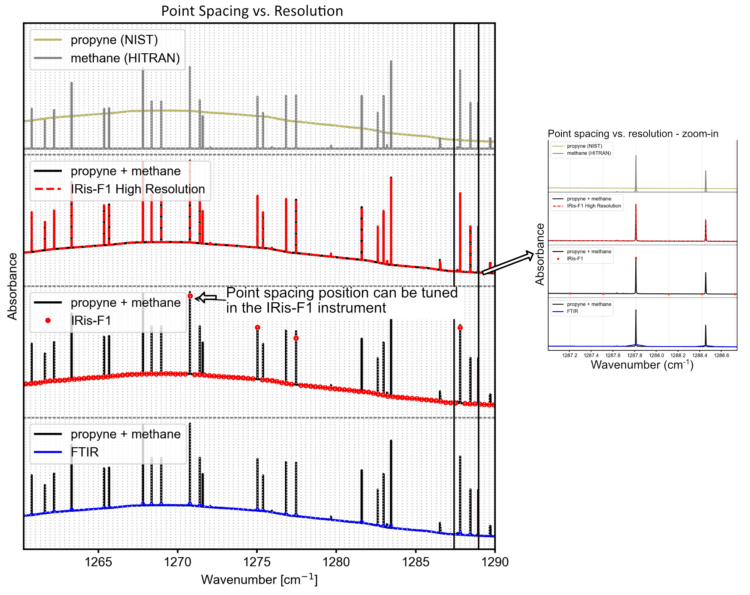
Khaki: experimental spectrum of propyne from NIST database as a model broadband absorber (p = 67 matm backfilled with N2 to 800 matm, path length: 0.05 m).
Gray: methane spectrum (HITRAN, p = 0.01 atm, T = 296 K, pathlength: 0.01 m) as a model narrow band absorber.
Black: A sum of propyne and methane spectra from the top panel – a model mixture spectrum.
Dashed red: the mixture spectrum as measured with the use of IRis-F1 in the high resolution option (point spacing <0.001 cm-1).
Red points: the mixture spectrum as measured with the use of IRis-F1 (0.3 cm-1 point spacing).
Blue: the mixture spectrum as measure with the use of FTIR (with 0.3 cm-1 resolution).
Fig. 1 shows the difference between point spacing and resolution. Exemplary case of mixture of a narrow band (methane at pressure 10 matm) and a broad band (propyne) absorber was chosen. An FTIR spectrum was simulated with the resolution corresponding to the spectral point spacing of the IRis-F1. While broad band absorbers are probed very similarly by FTIR and IRis-F1, the former does not retrieve information on the narrow band absorber.
With the IRis-F1, one can clearly see that the sample consists of at least two substances: one with broad absorption and one with very narrow absorption. Due to the point spacing, IRis-F1 shows the narrow lines at wavenumbers where a sampling point overlaps with the gas phase spectral feature. Where the points do not overlap, the lines will not be observed.
When the IRis-F1 is used in the high resolution option, information on the line shapes of narrow band absorbers can be also retrieved. A spectrum with point spacing <0.001 cm-1 throughout the covered spectral range can be measured. To achieve similar resolution in FTIR, it would be necessary to develop a several meter long interferometer.
Clear differentiation between two individual gases – the first necessary step for quantitative analysis – is only possible with the IRis-F1.
Related products
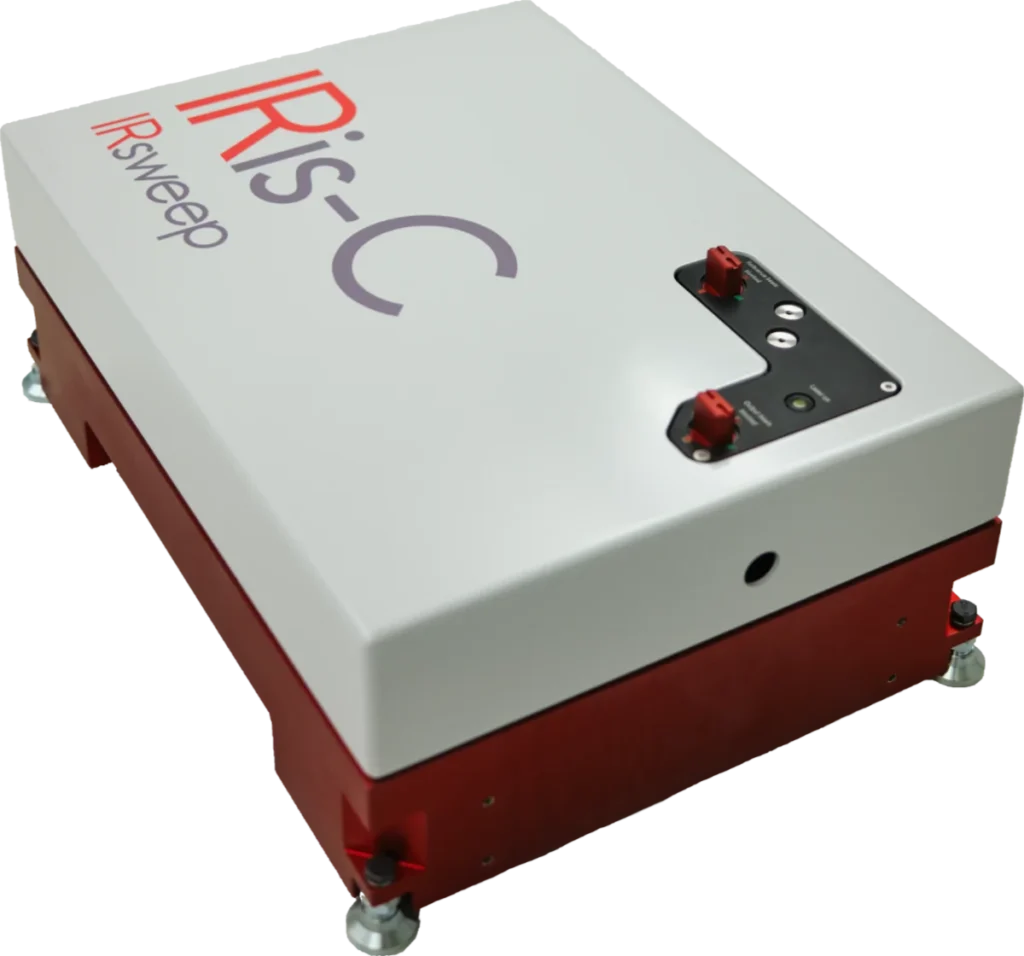
IRis-C
The IRis-C is the next generation instrument in IRsweep’s quantum cascade laser frequency comb spectrometer line. It uses the same dual-comb spectroscopy technology as IRsweep’s IRis-F1, offering microsecond time-resolution, high spectral resolution, and high optical brightness in the mid-infrared. With a substantial reduction in physical dimensions and price, it is easily adaptable to any type of application and fits even tighter budgets.
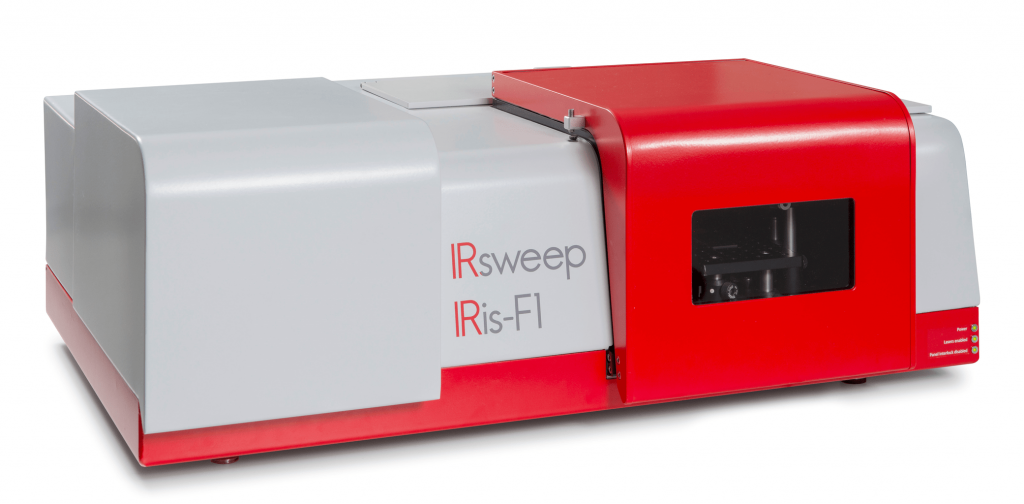
IRis-F1
The IRis-F1 spectrometer offers you an unmatched combination of speed, brightness and multi-color measurements. The quantum cascade laser frequency comb spectrometer is the first turn-key frequency comb spectroscopy system. As opposed to single-frequency operation, which necessitates tuning over your spectral range of interest, you will achieve a broad spectral coverage in a single-shot measurement.
IRis-core
The IRis-core is an ideal basis for the setup of such a system in the mid-IR range: It offers two overlapping free-running QCL-based frequency comb lasers in a single system. The system outputs already co-aligned beams and comes with a set of drive instructions with factory-characterized heterodyning conditions. The system comes complete with drive electronics and a control computer with a graphical user interface.